
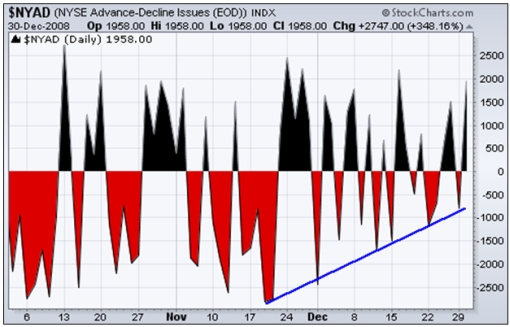
Prieur du Plessis of Plexus Asset Management is on the same page as me. However, his basis for an upcoming rally has more to do with market data trends. The first is the advance/decline spread which tracks the difference between advancing and declining issues and is widely used to measure the breadth of a stock market advance or decline. The chart below shows that the spread between declining and advancing issues on the NYSE has been moving in the right direction (for bulls) since the November lows and is actually again in positive territory.
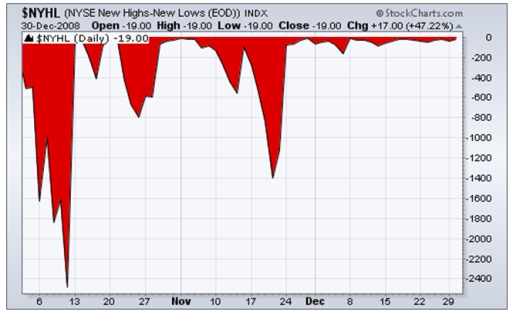
Net new highs are calculated by subtracting the number of new 52-week lows from the number of new 52-week highs. The panic day of October 10 marked an “internal bottom” when 92.6% of the stocks on the NYSE broke to new lows (whereas a “price bottom” was recorded on November 20). Net new highs have since improved markedly, but new lows are still in excess of new highs.
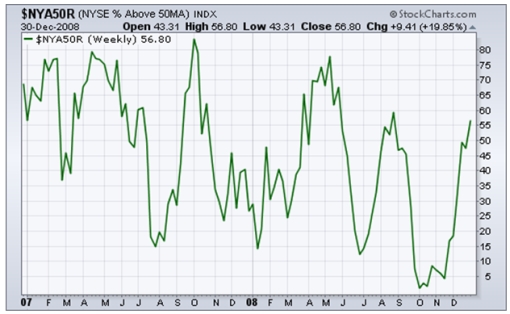
The number of NYSE stocks trading above their respective 50-day moving averages has increased to 56.8% from almost zero in October. In order to be bullish about the secondary trend, one would expect the majority of stocks to be above the 50-day line. For a primary uptrend to manifest itself, the bulk of the index constituents also need to trade above their 200-day averages. This is a slow indicator, but the number at the moment is still a non-existent 8.0%.
No comments:
Post a Comment